16 Apr Math Gems: Goldfish, The Button, & Hurricanes
Math Gems are stories, articles, puzzles, or tools that have intrinsic mathematical qualities that are not overtly expressed. I believe that there are potential benefits of exploring the math hidden within the structure of what is presented in the deep, dark corners of the interweb. Namely enhanced interest, inquiry, and more realistic application of learned concepts.
If it’s subtle, interesting, and applicable to mathematics, I consider it a gem. No “Math Blaster” games allowed. I leave it to you, the reader, to connect the dots on the necessary curricular connections, relevant standards, and grade levels.
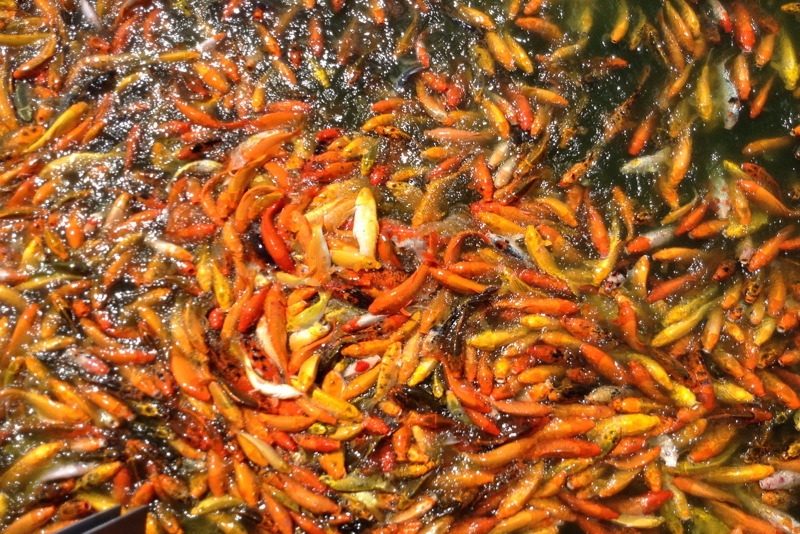
3,000 Goldfish
Website: Aquarium Goldfish Dumped Into Lake, Multiply to 3,000 Fish
Description: A naive individual(s) dumped an unspecified number of non-native goldfish into a pond in Boulder, CO. Three years later, the total number of goldfish is estimated at 3,000. The quickly multiplying, invasive animals potentially carry viruses and compete for food sources with endangered fish. Biologists believe that the goldfish will harm the ecological balance in the local ecosystem.
Questions:
- Guiding Question: If there are 3,000 goldfish currently in the lake, then approximately how many were initially released?
- What are the important factors to consider when answering the guiding question?
- Factor 1: What assumptions can be made about the sex/gender of the initial goldfish?
- Factor 2: Approximately how many eggs does a goldfish produce? On average, how many eggs reach mature status?
- Factor 3: What is the approximate lifespan of a goldfish?
- Factor 4: If there are 3,000 goldfish in the lake now, how does this help determine the initial quantity of goldfish released?
- Factor 5: In order to estimate the initial number of goldfish released into the pond, what general assumptions should be made and what information should be disregarded? Why?
- What is exponential growth?
- How might you model your conjectures using spreadsheets and graphs?
- What conclusions might be made about the ecological impact of releasing household goldfish into natural ponds or lakes?
- How might you apply what you know so that it impacts your community? Do it.
Related Resources: Goldfish (Wikipedia article), Check Out This Photo of a Pet Fish That Grew Into a Feral Aquatic Killer (TIME: Environment article)
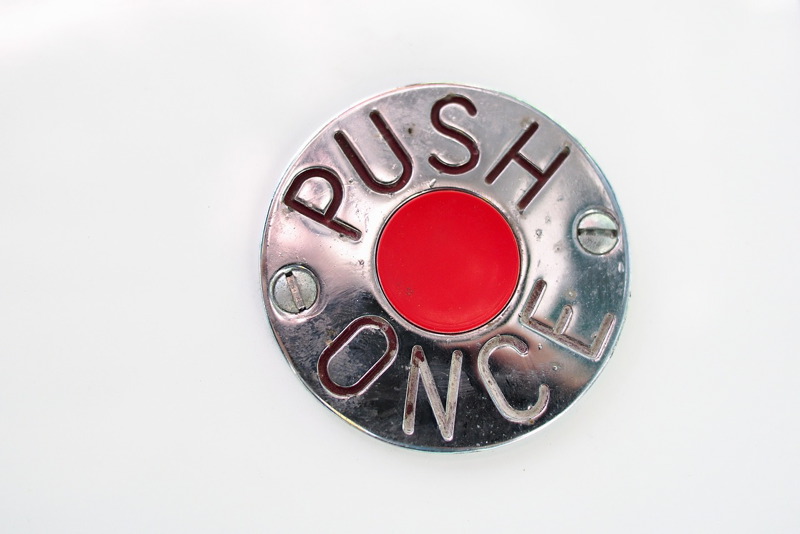
The Button on Reddit
Website: The Button
Description: Posted on Reddit by a user named powerlanguage, “The Button” is a web-based, 60-second countdown timer next to a small button. The premise is simple: Keep the countdown going by pressing a button before the timer expires. Each time the button is pressed, the countdown begins again at 60 seconds. Anyone with a Reddit account older than April 1, 2015 may reset the timer but only once. Over 750,000 people have participated to date, and the clock has yet to reach 00.00 seconds when this post was published.
Questions:
- Guiding Question: How would one create an interactive, participatory experience that resonates with individuals across the Internet?
- What is the average time (in seconds) that the countdown timer elapses before it is reset by a user?
- What are the important pieces of information that help to determine the average elapsed time of the countdown timer?
- How might one mathematically model the number of active users at any one point in time and then longitudinally show the relative popularity of “The Button?”
- If an individual is allowed to press the button more than once, how would that impact elapsed time averages? Would it make a difference?
- What do the color-coded circles represent on the right side of the page? Hint: Read some of the posted comments (some of the comments are NSFW or NSFS).
- What are a couple of simple, participatory experiences that you might create that would engage the imagination of people on the Internet?
- How would you use data to evaluate your imagined participatory experience?
Related Resources: The Addicting, Apocalyptic Psychology of ‘The Button,’ the Reddit Game That Ate the Internet (The Washington Post article)
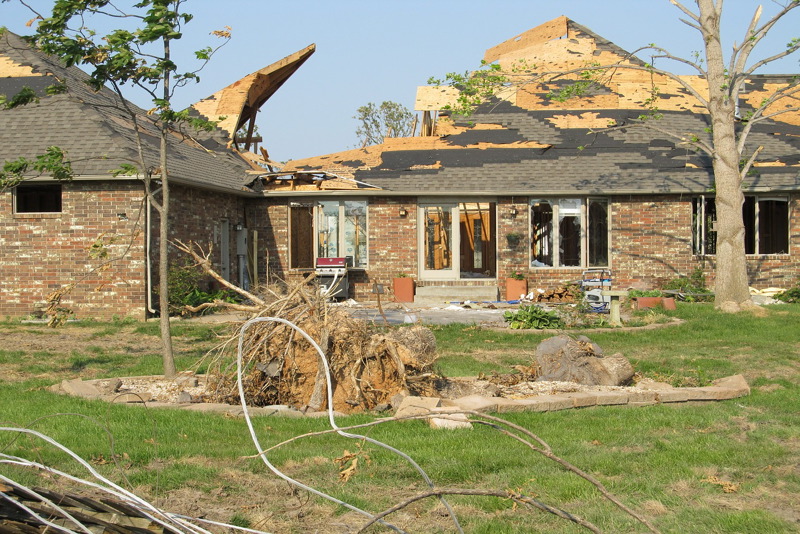
Hurricane Damage
Website: How Do They Estimate Hurricane Damage?
Description: “Why do Katrina numbers vary all the way from $25 billion to $100 billion?” This tagline begins a summary of how statisticians, meteorologists, and engineers model predicted damages caused by hurricanes and tornados. Forecasters use estimated wind speeds, values of neighborhoods for particular zip codes, and the types of structures in the storm zones to assess financial impact. However, historical comparisons and unique buildings don’t affect mathematical models.
Questions:
- Guiding Question: What is the financial impact of a hurricane or tornado hitting your neighborhood?
- Read the article. What are the data points or necessary factors that one needs to know to create a model of the financial impact of a storm in a particular area?
- How might you use spreadsheets and graphs to model and convey important information?
- What makes unique structures or objects difficult to include in financial predictions?
- What do you know about the value of money today versus yesterday?
- Is the financial impact of a tornado or hurricane the only consideration when “storm-proofing” a particular area? What about residential zones? Commercial zones? Heavily populated areas like NYC? Hospitals?
- How might you apply what you know so that your work positively enhances your community? Do it.
Related Resources: The National Hurricane Center, Zillow Real Estate Search Engine
- [accordionitem]
Beads, Colorful, Decoration – Free Image on Pixabay. (n.d.). Retrieved from http://pixabay.com/en/beads-colorful-decoration-jewelry-508482/
Button, Alert, Push, Once, Stop – Free Image on Pixabay. (n.d.). Retrieved from http://pixabay.com/en/button-alert-push-once-stop-bus-623174/
Koi Fish, Pond, Fish, Koi, Water – Free Image on Pixabay. (n.d.). Retrieved from http://pixabay.com/en/koi-fish-pond-fish-koi-water-274173/
Tornado, Destruction, Joplin – Free Image on Pixabay. (n.d.). Retrieved from http://pixabay.com/en/tornado-destruction-joplin-missouri-375135/
[/accordionitem]
Sorry, the comment form is closed at this time.