30 May Testing the Rivanna River’s Water Quality
The Rivanna River criss-crosses Albemarle County in central Virginia. It’s a major recreational waterway for fisherman and boaters that traverses through Charlottesville, under roadways, and around housing developments. The Rivanna’s tributaries originate in the Blue Ridge Mountains, flow into the James River, and contribute to the Chesapeake Bay Watershed.
Like other rivers in similar locations, the Rivanna River is subject to human encroachment activities, and it’s health has local ramifications as well as regional significance. The immediate Charlottesville area uses the Rivanna River as a source of water for agriculture, groundwater, fishing, swimming, and boating. Each gallon of water flows into the Chesapeake Bay Watershed which is a vital food source, natural buffer and filter for the Atlantic Ocean, and essential cog in the ecosystem. Population growth in Albemarle County and along the east coast contribute to problems impacting this waterway; organizations like the Rivanna Conservation Alliance believe that stormwater runoff, wastewater, over fertilization of crops, and housing developments are some of the deleterious effects of people on the Rivanna River.
The Rivanna River’s general stability concerns many people including Chris Stanek, an environmental science teacher at Monticello High School in Charlottesville, VA. It’s for this underlying reason that he decided to help a group of students build an Arduino Water Testing Station to monitor and analyze portions of the river. Part citizen science initiative and part curricular project, it exemplifies project-based learning at its most authentic and meaningful.
This is the story of the MoHS Arduino Water Testing Station.
Planning
I first worked with Chris Stanek in the Fall when he asked me to help design an Arudino-based weather project for his environmental science classes. When that unit wrapped, Chris mentioned that he had another idea in mind: Studying the Rivanna River’s water quality using homemade instruments as a way to capture snapshots of the waterway’s health. We both agreed that this would be a fun but challenging approach to water quality testing, and we set some meeting dates after the winter break.
When January rolled around and the Spring semester was in full swing, Chris and I met to plan the framework for the Arduino Water Testing Station and what he wanted students to learn from participating in the project.
Chris said that he wanted to conduct water quality analysis using tools that would produce data sets that could be mathematically manipulated in spreadsheets. Autonomous deployment was also important; Manually collecting measurements by hand and running isolated field tests once a month would not produce the data that Chris believed would be useful. He wanted an instrument that could be placed in a river or stream to collect readings without someone physically present. It needed to be weatherproof, sturdy, and functional to the extent that it could run for several hours or days without maintenance or checking.
In terms of learning, Chris and I both stipulated that the projected needed to be student-driven during all phases of the project. To the extent that time permitted, any participating students needed to understand how to program the electronics and debug technical issues with the code and hardware. Designing and building the housing for the Arduino Water Testing Station was also a responsibility we wanted the high school participants to assume. Finally, we decided that the curricular connections should incorporate both mathematics and science. Namely, students should form hypotheses and draw conclusions based on longitudinal trends in the data corpus.
Identifying Electronic Components
After articulating the project parameters, Chris and I spent a couple of weeks identifying and purchasing all of the components for the Arduino Water Testing Station. We considered off-the-shelf kits and product offerings from companies like Vernier that did not need an Arduino or another type of microcontroller. Ultimately, however, none seemed to offer the customizability or features that would enable us to deploy an autonomous water testing station like what we envisioned. We needed an Arduino with compatible probes, circuits, sensors, and modules.
The Purchasing Spreadsheet contains all of the electronic items that are necessary to build the Arduino Water Testing Station. It does not include materials for constructing the housing container.
We settled on a kit of circuits and probes made by Atlas-Scientific. The ENV-SDS Kit provided four major measurements that Chris believed would provide an accurate assessment of the Rivanna River- pH, dissolved oxygen, conductivity, and water temperature. It also included an ORP circuit and probe (which we did not end up using). Although we wanted to include a water flow measurement, none of the Atlas-Scientific meters were able to accommodate the flow rate of the Rivanna River even under calm conditions.
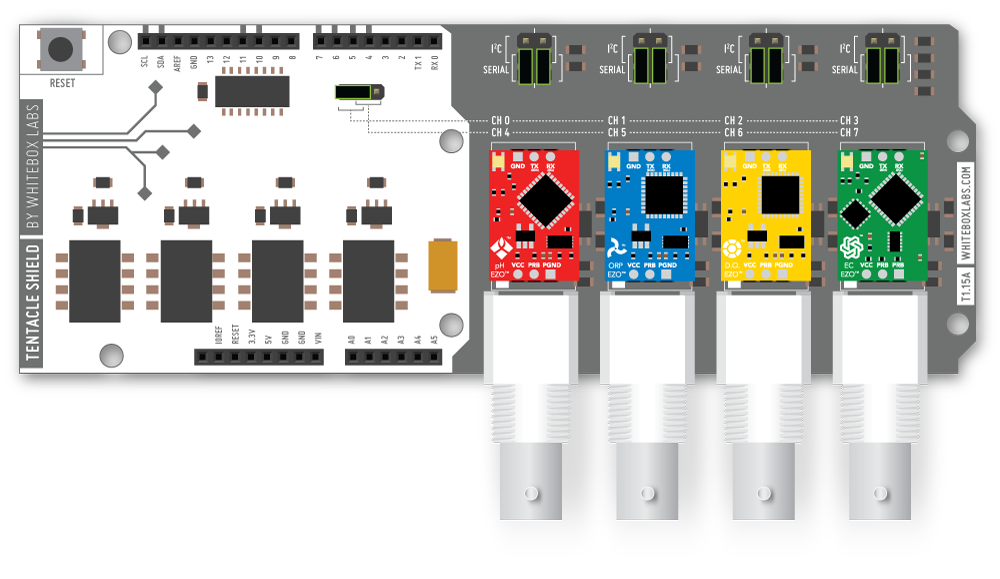
The Atlas-Scientific ENV-SDS Kit was expensive ($800) but addressed all of the project requirements. First, all of the included circuits and probes connected to an Arduino microcontroller. This prerequisite ensured that we could automate data collection by coding continuous measurements at specific time intervals without being physically close to the device. Second, each circuit was highly accurate and well documented. Atlas-Scientific included detailed manuals for calibrating the probes and connecting them to an Arduino. Finally, the ENV-SDS Kit worked with an aftermarket Arduino shield made by Whitebox Labs called the Tentacle Shield. The Tentacle Shield allowed us to plug each circuit into the shield without additional wiring or electrical interference.
I also made a list of additional items that we needed to build a working station. This included a battery-powered clock (RTC) for time-stamping each measurement and a Micro-SD Card module for saving data in the field. Required components like an Arduino Uno, jumper wires, batteries, and a breadboard were identified and purchased to complete the station.
In February after all of the electronics arrived, Chris distributed a notice to his environmental science students to see who might be interested in participating in the project. Two high school seniors, Becky and Perry, jumped at the opportunity and joined in time to begin calibrating and wiring the electronics for the Arduino Water Testing Station.
Probe Calibration
Becky and Perry entered the project with a tough task to complete: calibrating the four probes for the Arduino Water Testing Station. Although they did not know a thing about microcontrollers or probes, both students understood the importance of having accurate measurements- something that would not be possible without individually calibrating each instrument.
I wrote a tutorial to guide their work because, honestly, I had difficulty figuring out how to calibrate the probes. The Atlas-Scientific instructions were quite detailed but included too many optional approaches to accomplish the same task. My interpretation of the multistep process involved shorting each circuit, uploading an Arduino sketch, testing each probe, and switching the circuits to I2C mode- an activity that was still complex. It took Chris, Becky, and Perry a couple of weeks to calibrate all of the probes, and I helped them with all of the procedures until they were comfortable doing it without assistance.
The Probe Calibration Tutorial is not written for a novice to understand. It includes terminology and steps that require assistance from someone who knows about Arduino programming, pins, prototyping with a breadboard, and general wiring.
Station Wiring & Coding
With all of the probes calibrated, Becky and Perry began a “setup gauntlet.” I don’t remember the exact experience but what I do recall is that they would take one step forward and I would nudge them two steps backwards. It was partly my fault; I was learning how the shield, probes, and circuits worked with the datalogging modules I purchased. I was often hovering just beyond their knowledge of what needed to be done.
Boiled down to its most simplistic form, Chris and the high school students did the following:
- Configured the Tentacle Shield to use the I2C communication protocol. This included placing all of the calibrated circuits onto the shield and moving jumpers around.
- Identified the I2C channels for each circuit on the Tentacle Shield.
- Tested the Tentacle Shield, circuits, and probes for reliable and accurate readings.
- Set the Real-Time Clock and wired it to the breadboard and Tentacle shield.
- Flashed the Micro-SD Card and wired the Micro-SD Card Module to the breadboard and Tentacle Shield.
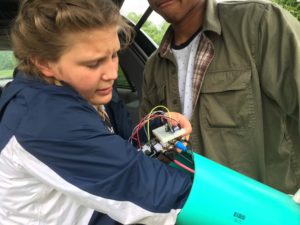
- Downloaded and uploaded two Arduino sketches that powered the Arduino Water Testing Station.
I wrote the tutorial that’s linked below to guide them through the nuances of each step.
A note on the Arduino sketches: I wrote the sketches, not the students. Chris and I felt like it was too much to ask Becky and Perry to do this given our time constraints. So, I pieced together the code from a random array of Internet sources. However, Chris and I did spend time explaining how the sketches worked in tandem to queue the probes, take a reading, and save the data to the Micro-SD card.
The Station Wiring & Coding Tutorial contains all of the instructions and code to build the electronics for the Arduino Water Testing Station. Although I am providing direct links to the two primary sketches below, there are other code files for testing the I2C channels and setting the RTC. See the tutorial.
Housing
In my opinion, designing and constructing the housing that held the electronics was the most rewarding part of the project. It gave me a chance to offer Becky and Perry suggestions without having to assume too much responsibility. They picked the station’s form and had to wrestle with protecting the Arduino and circuits when placed in a water-saturated environment. Chris and I injected our opinion when they missed an important consideration but it was ultimately the students who produced the final enclosure that went into the Rivanna River.
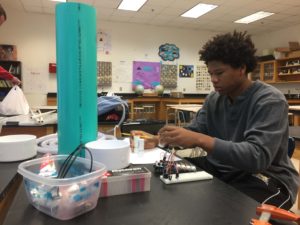
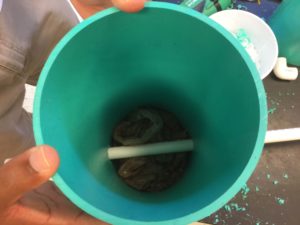
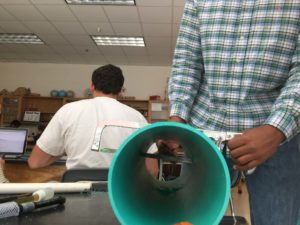
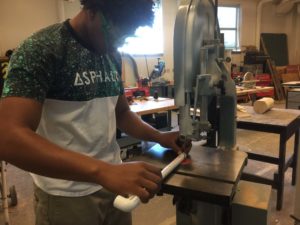
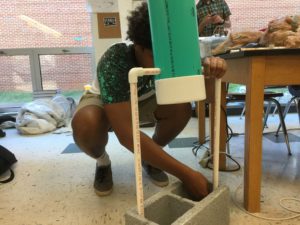
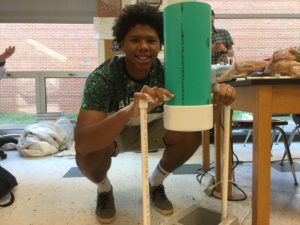
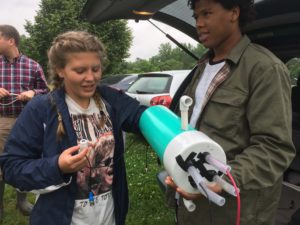
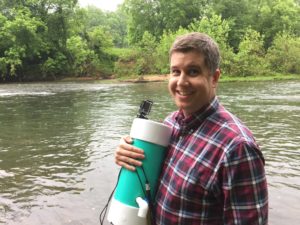
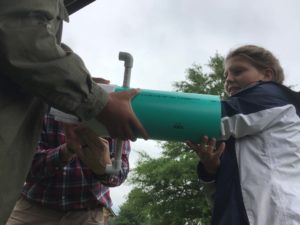
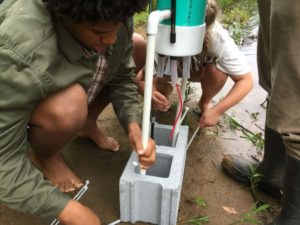
Becky and Perry decided that they would build a capsule out of different sizes of PVC pipe. They used a 4″ piece of pipe for the main housing and added end caps for the bottom and top. Smaller 3/4″ PVC pipe was cut and then fitted with right-angle couplings to form a two-legged stand. The stand was attached to a cored concrete block with extra large zip ties.
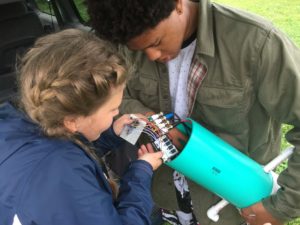
The Arduino, Tentacle Shield, breadboard, and modules rested on a piece of 3/4″ PVC pipe that extended through the capsule. Becky and Perry packed the bottom with grocery bags to soften any jolts to the main capsule, and they fed the probes through hosing in the bottom cap. All of the gaps were sealed with silicone and a generous amount of electrical tape.
Deployment
Date: Tuesday, May 23, 2017
Time: 4:00 PM
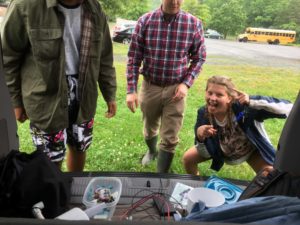
All four of us gathered in Chris’s room at Monticello High School. It was perfect weather to test the Arduino Water Testing Station: 65º, overcast, and rain in the forecast. We packed up all of the supplies and the freshly sealed apparatus and drove to a nearby elementary school that backed up to the Rivanna River.
The first 30 minutes at the testing site was spent assembling and re-assembling the testing station in the school’s parking lot. We checked and double-checked the wiring, applied a healthy amount of electrical tape around the seals, and trudged off to the woods on a half-mile hike to the river bank.
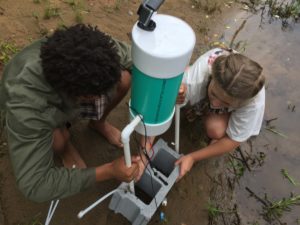
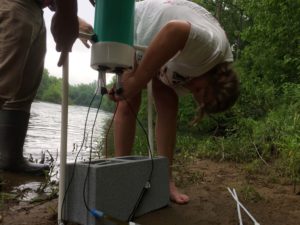
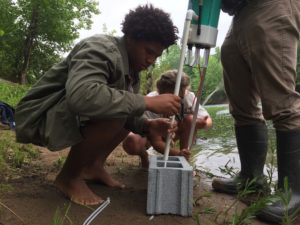
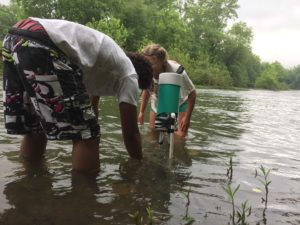
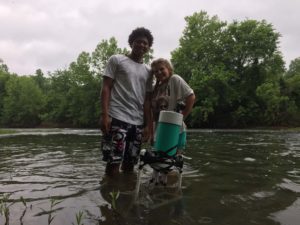
Becky and Perry almost immediately began their final preparations when we touched the shallow waters of the Rivanna River. They zip-tied the stand to the block, wrapped circles of electrical tape around the main housing, and walked the station about 5′ from the water’s edge. Becky carefully coaxed the probes into the water away from the concrete block as Perry gently let go. Resting broadside to the flow of the current, the Arduino Water Testing Station began collecting real, hard data about the water’s chemistry. At about 6:00 PM, we turned our attention to the hike back to our cars as sprinkles of rain began to ping off of leaves.
Retrieval & Analysis
I had to proctor a standardized test the next morning while Becky and Perry returned to the Rivanna River to retrieve the station. From what they told me later that afternoon, a large branch knocked the station over at some point during the previous evening’s storm. Most of the main housing was submerged in the river, and water poured out of the area where the Arduino and circuits sat. They drained what they could, packed everything up in a van, and drove back to Monticello High School with little hope of examining data from the soaked electronics.
Everyone gathered during the final block of the day. While the students tore off electrical tape, Chris and I dried the electronics with paper towels. Piece by piece, we laid out the expensive components and threw away the cheap parts that were clearly damaged by the river water. The last part we examined was the Micro-SD Card. It did not look corrupt to the naked eye, so I placed it in a card reader and mounted the drive on my computer.
Lady Luck looked down upon our homemade contraption. Inside the Micro-SD Card was a .csv file with five hours of good data! Although the probes quit measuring at 11:00 PM the previous evening when the branch broadsided the stand, the Arduino Water Testing Station gathered over 1000 timestamped data points. Success.
I helped Becky and Perry import the .csv file into a Google Spreadsheet. After a few minutes of instruction, Becky was able to make a preliminary graph of the pH, temperature, and dissolved oxygen of the Rivanna River (see below). Chris discussed what some of the changes might mean but the final bell interrupted our conversation.
The Rivanna River Data Spreadsheet contains the readings from the first deployment on May 23, 2017. Ignore columns B and C when looking at the spreadsheet- column D contains the true time signatures. Our RTC was off by one hour!
Conclusion
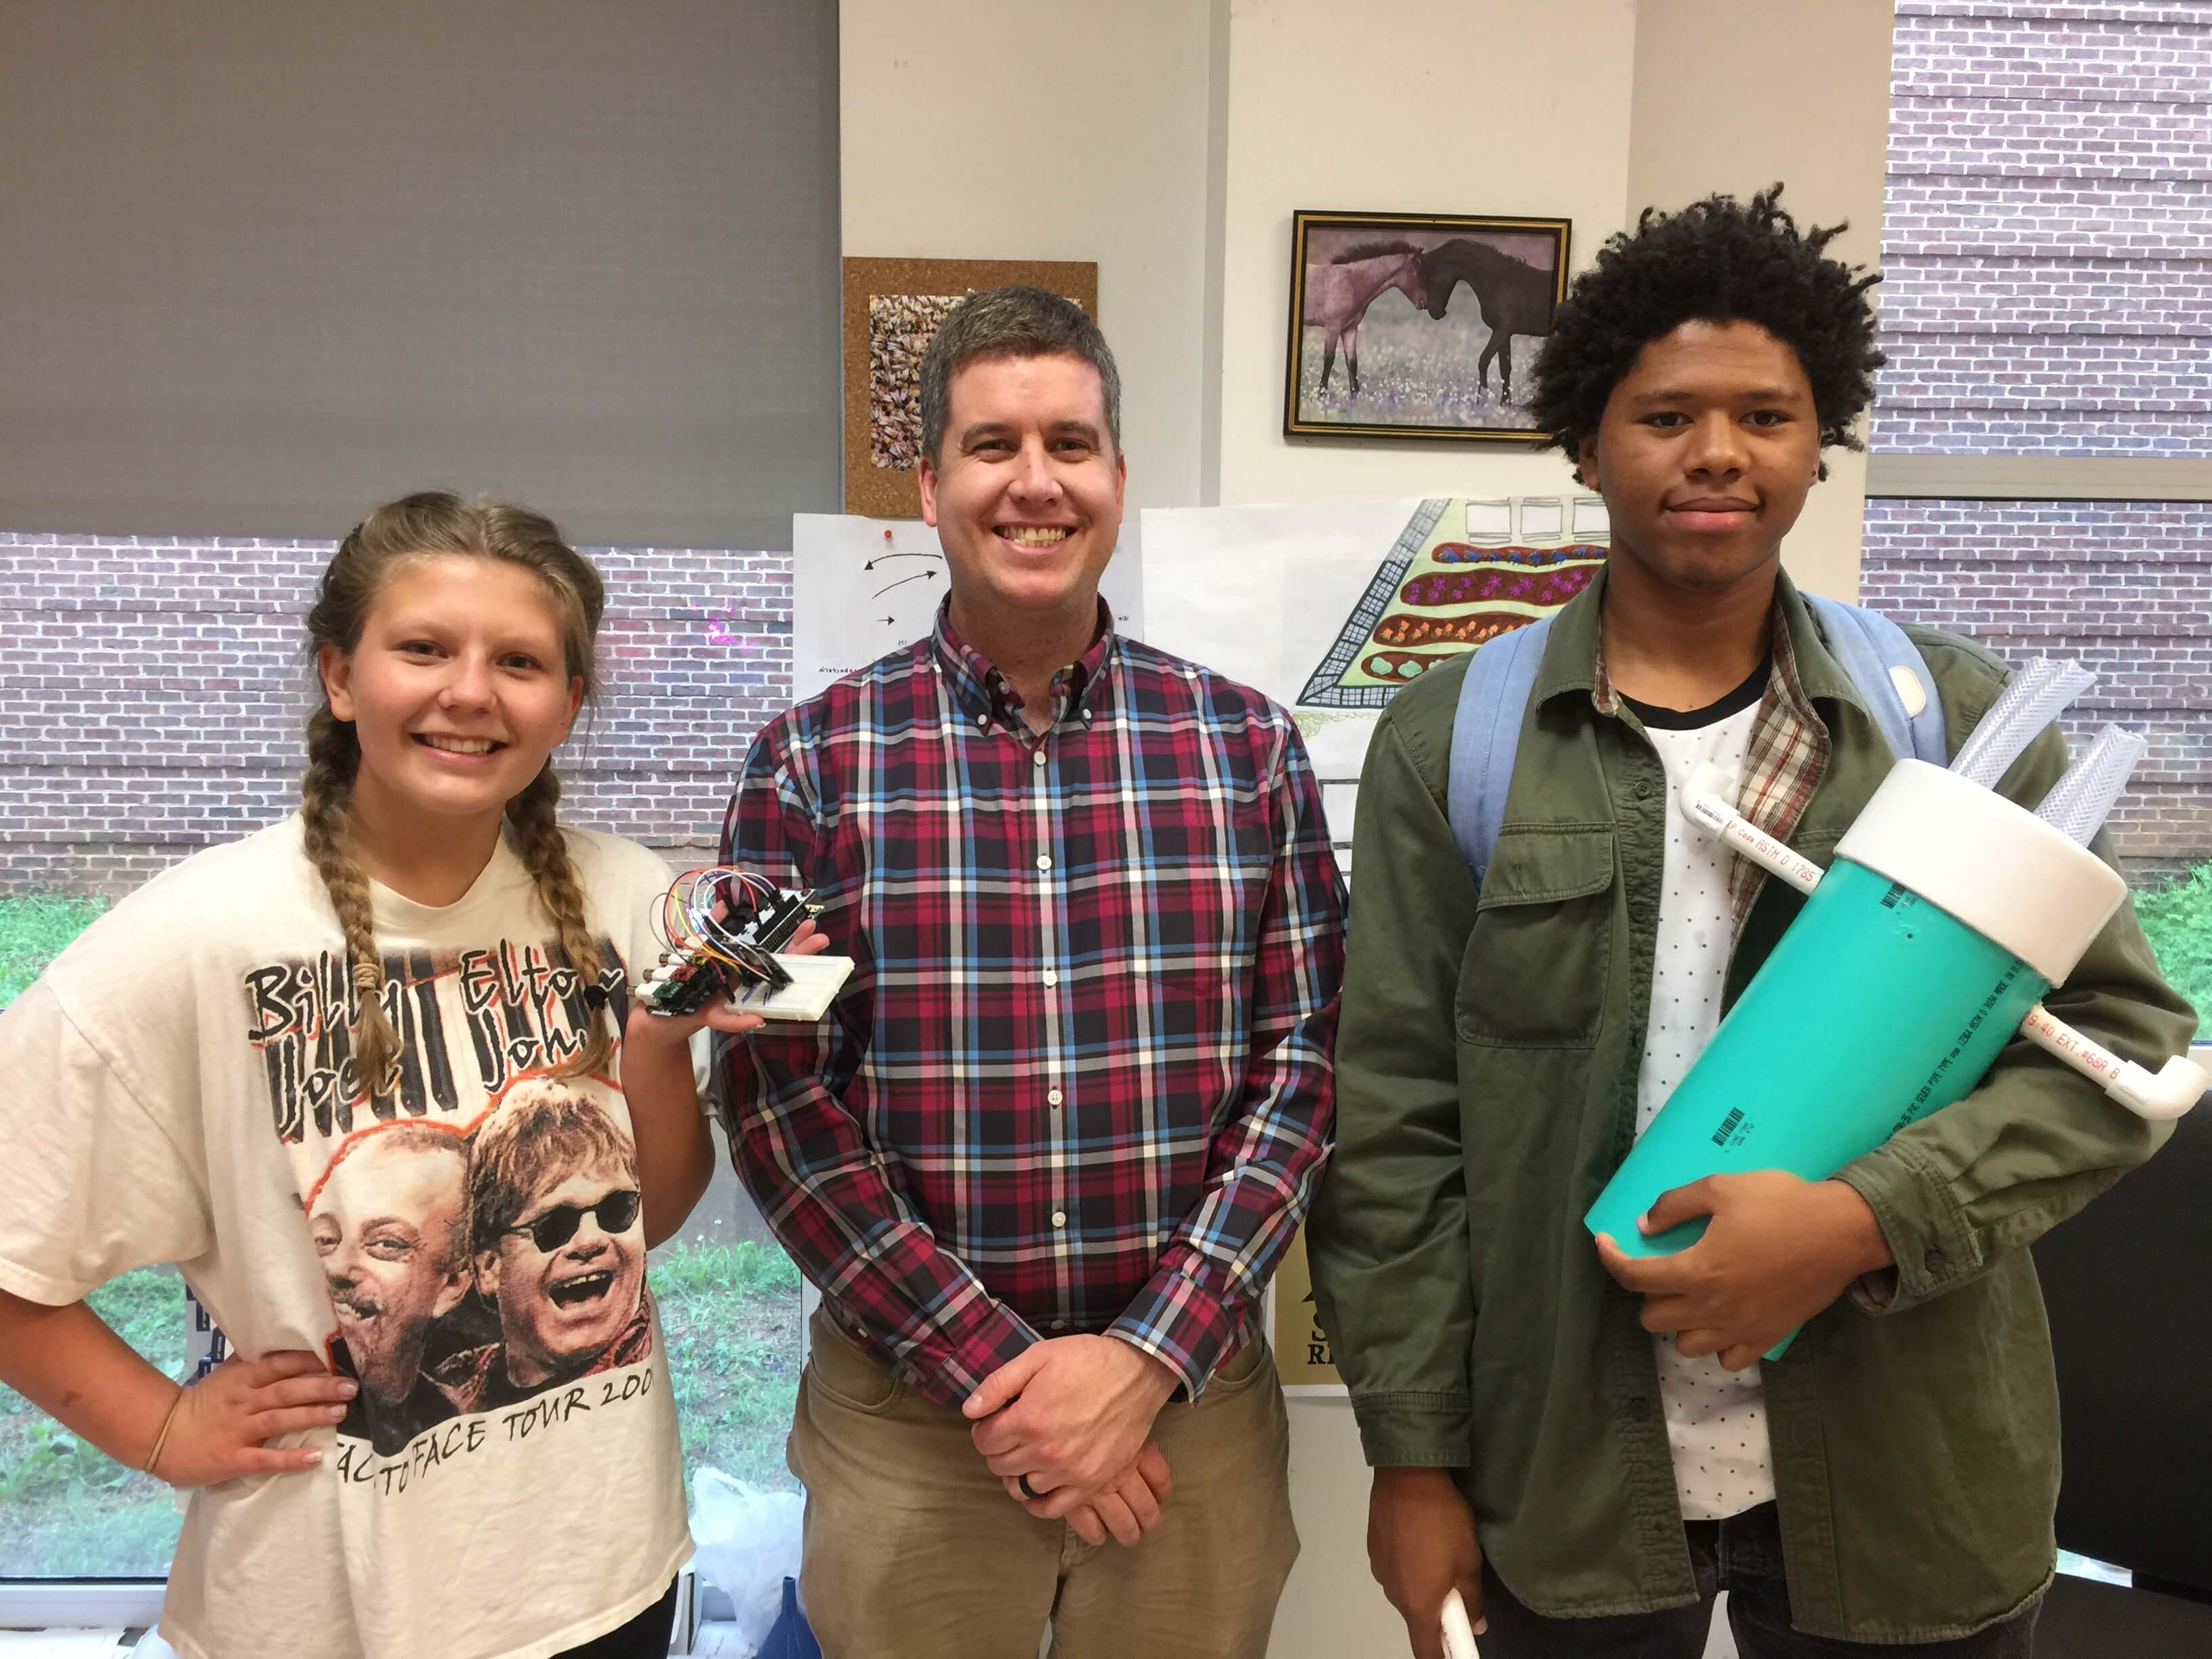
That’s how the project ended: Becky and Perry walked out of the classroom on the day that they retrieved the Arduino Water Testing Station from the Rivanna River. Both were seniors and literally finished high school two hours later.
Chris and I lingered in the classroom for a few minutes on that final day. I told him that everyone learned a lot from the experience, and there were many changes that could be made for a more successful “next iteration.” Revisiting the housing design and waterproofing was one modification. Not placing the station perpendicular to the river’s current was another. Mistakes aside, I expressed how pleased I was with how the first test run went; Chris, Becky, and Perry completed a very complex project that not many high schools would even attempt. Heck, we even had some experts tell us that it could not be done!
As we parted ways, Chris and I agreed that we were both blessed to have worked with two dedicated, interested, and passionate students like Becky and Perry. We set some dates to debrief and revisit the data during the first part of the summer, and I left the room hoping that part 2 of the Arduino Water Testing Station would begin soon.
Notes
I encourage other people to use the tutorials and resources in this post to build their own Arduino Water Testing Station. Please post any questions in the comment section below.


Sorry, the comment form is closed at this time.